
VendorProof Dashboard Update
We are launching a new and improved dashboard for VendorProof! The new dashboard provides you with a lot more insight and transparency into your universe of vendors, especially when it comes to the quality and completeness of the data and your workflow for reviewing and managing exclusion monitor alerts.
Why we built it
While we wish we could say we originally built a dashboard that users love, we didn’t! So it was time to re-think the information provided on the dashboard and present things in an easy-to-understand and meaningful way. This especially proved true when we adopted the Progress Status model for managing monitor alerts in the Fall of 2018 (Read more about Progress Statuses here: Progress Status Release - September 18th, 2018)
What’s on the dashboard
When we rethought the VendorProof dashboard, we wanted to be sure that we were providing useful and meaningful insight into your vendor population that is monitored and managed within VendorProof. The dashboard is organized into 2-4 cards, depending on which services are being used within the VendorProof platform.
All users will see the following two cards on their dashboard:
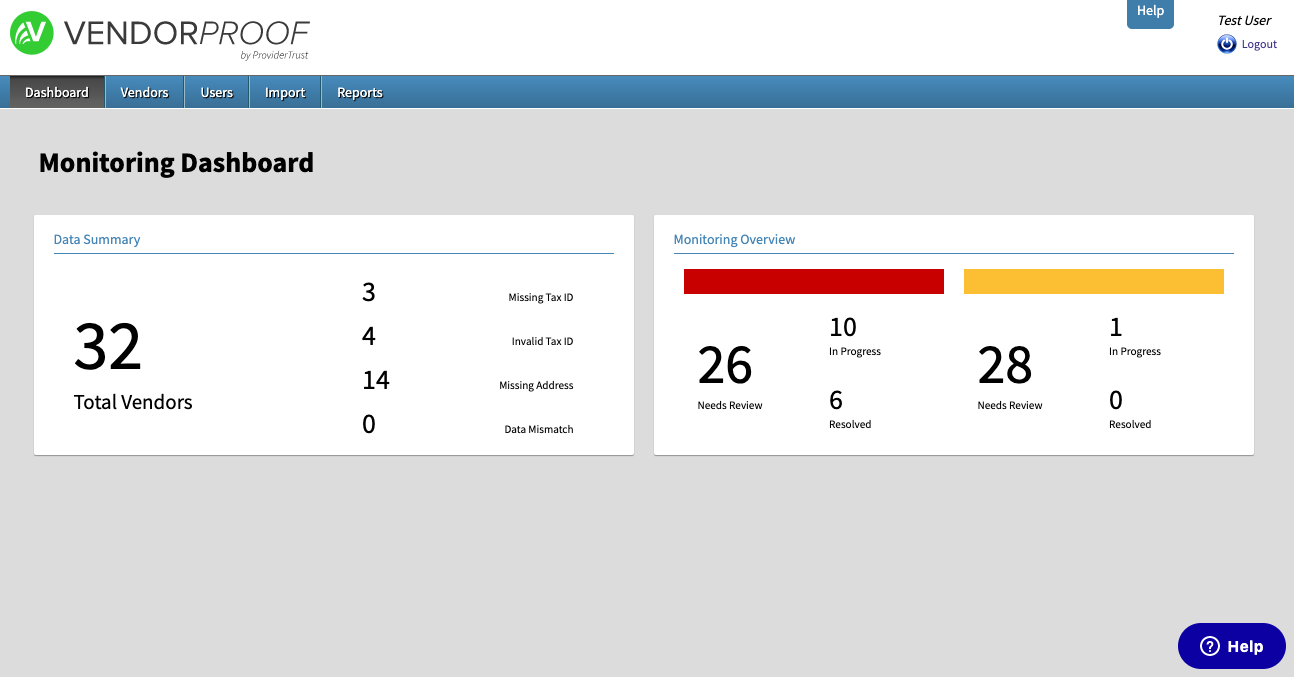
Population Summary/Data Quality
Just like the old dashboard, we want to provide general statistics about your vendor population. Most of the statistics are similar to the old dashboard, however we added in a statistic focused on address information. Each statistic is clickable and will take you to a filtered view of the Vendor Management page, focused in on the records matching the clicked statistic. The stats included on this card are:
- Total vendors - this represents the total population we are monitoring. (Note - if you are using vendor groups, all of the stats on this card are about the groups rather than the total records)
- Monitored vendors - this represents the total population that we are monitoring. In most cases, this will be the same as the total population. If the count is lower than the total population, that’s probably something to look in to!
- Missing Tax ID
- Invalid Tax ID - if we are providing IRS TIN matching for your population, we’ll let you know here the total number of mis-matched records
- Missing Address - this represents the number of vendors (or groups) missing city, state, and/or zip code information
- Data Mismatch (Engage users only) - if information provided by vendors in Engage is different from your vendor data, we display a data mismatch
Monitoring Overview
This part of the dashboard is something we are really excited about. This section now reflects the current state of your organization’s progress in reviewing monitoring alerts. We categorize the alerts into Red (match/suspected match result) and Yellow (unable to determine), and show where monitoring alerts are in the review process for each level of severity. Clicking on each statistic will filter the Vendor Management page to vendors with monitoring records matching the result & progress status combination. From there, you can click in to the vendor and review/manage these alerts as usual.
Our goal with this section of the dashboard is to give users who are managing this process an easy tool to zero in on each subset of records to be managed, and to give other users a snapshot into where things are in the process. We would love to know how useful this new tool is!
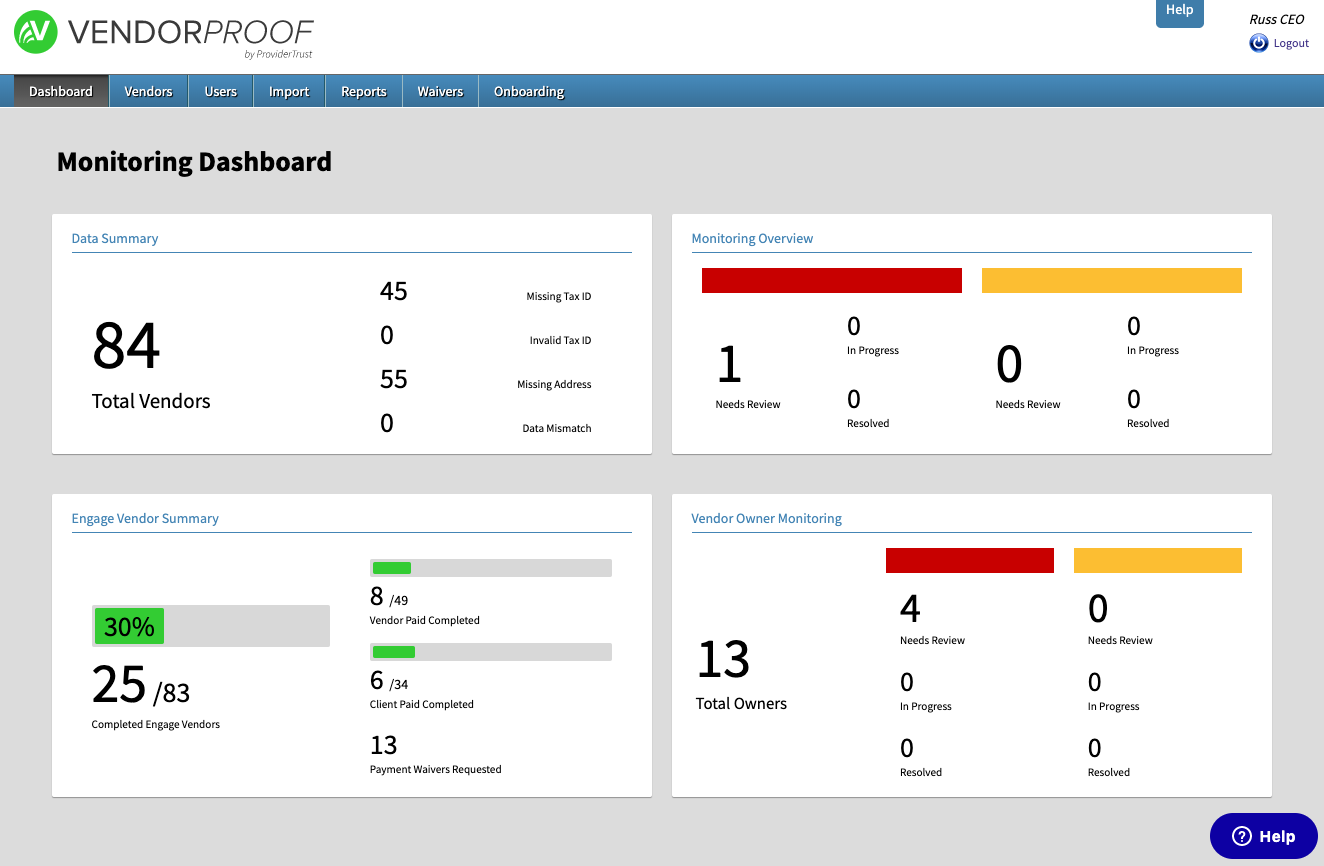
Engage users will see two additional cards on their dashboard:
Engage Target Population & Signup Summary
This is one of two cards that is visible for Engage customers. This card gives users a summary of the Engage population (i.e. which vendors are included in this program) as well signup progress for Engage vendors.
The Engage Target Population card gives you insight into how many vendors are expected to enroll in Engage, including a breakdown of how many are expected to pay for their subscription vs how many third parties for which your organization will cover the cost (i.e. non-employed/contracted physicians).
The Engage Signup Summary gives you insight into how many vendors out of your Engage population have enrolled in VendorProof. This includes:
- Total Completed - this counts any vendor in a completed state (paid, requested payment waiver, etc.)
- Vendor Paid Completed - this counts how many vendors that were expected to pay have completed the enrollment and paid their subscription fee
- Client Paid Completed - this counts how many vendors that your organization is paying for that have completed enrollment
- Payment Waivers Completed - this counts how many vendors that have completed enrollment and submitted a payment waiver request
- Progress Tracker - this percentage compares the Total Completed to the Total Engage Vendors (i.e. Target Population)
Vendor Ownership Monitoring
As Engage vendors are providing ownership information about their business, VendorProof monitors these owner individuals or entities for exclusions. This card summarizes how many total owners are being monitored and a similar summary of Monitoring as the Monitoring Overview card above (however is only showing this information for vendor owners).
We’re excited to share this new feature with you and hope that it is a useful tool for you and your organization. Let us know what feedback you have - we would love to hear from you!
Comments
0 comments
Article is closed for comments.